
Find a place to call home in Vancouver
Check a rental before you sign, or compare neighbourhoods on price, safety, commute and amenities. Made for students renting in the City of Vancouver.
Prefer to keep this page open? Open Explore in a new tab
Each block of the city, brighter where more is within a walk. Lines show the bus routes and SkyTrain.
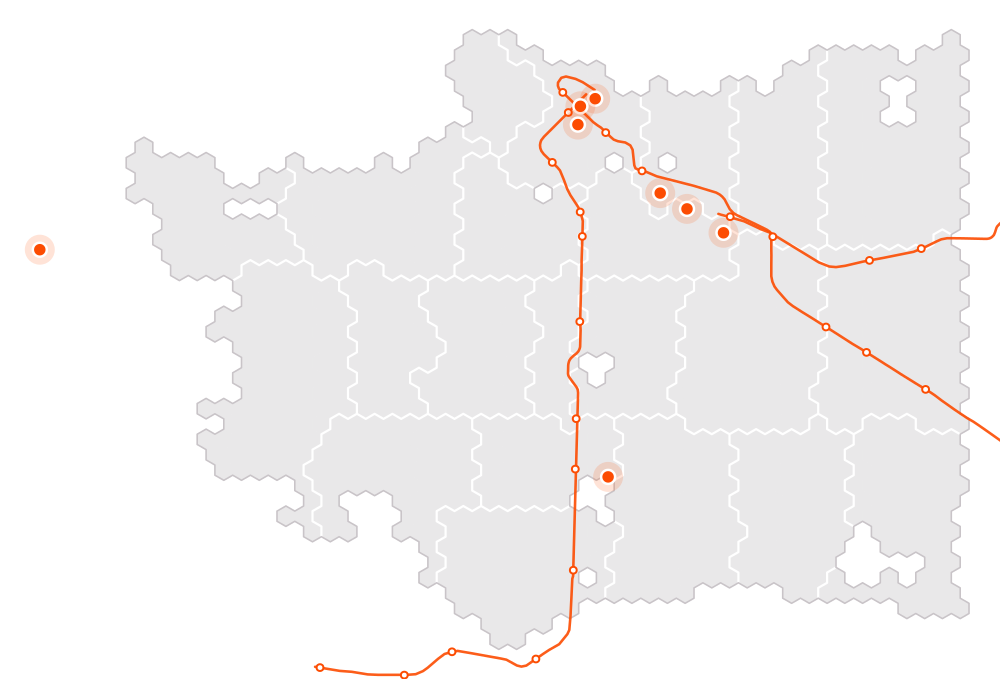
- 22 neighbourhoods
- SkyTrain stations
- Campuses
Vancouver around you
Every one of the City's 22 neighbourhoods, split into about 1,300 blocks of 180 m. Explore colours each block by how well it fits what you picked, and ranks the neighbourhoods as you go.
- Arbutus Ridge
- Downtown
- Dunbar-Southlands
- Fairview
- Grandview-Woodland
- Hastings-Sunrise
- Kensington-Cedar Cottage
- Kerrisdale
- Killarney
- Kitsilano
- Marpole
- Mount Pleasant
- Oakridge
- Renfrew-Collingwood
- Riley Park
- Shaughnessy
- South Cambie
- Strathcona
- Sunset
- Victoria-Fraserview
- West End
- West Point Grey
What a listing check shows
One report per address, with every number naming its source and date.
-
Rent against the area medianThe asking rent next to the CMHC median for the same bedroom count in that part of the city.
-
Commute on the real scheduleTimed weekday transit routes to your campus, with walking, waiting and up to one transfer.
-
Open by-law issues firstIf the City lists unresolved by-law issues at the building, they are the first thing in the report.
-
What is within a walkGroceries, cafes and restaurants within 5, 10 or 15 minutes, on the map and in a list.


Compare every neighbourhood on what matters to you
Pick the factors you care about and set how much each one counts.
- Price: median rent for your bedroom count
- Safety: police-reported property crime per resident
- Commute: timed transit to your campus
- Amenities: groceries, restaurants, cafes and cinemas
Built on public data
Price, Safety and Amenities are ranks against the rest of Vancouver, so a slider set to 30% pulls the map about 30%. Commute stays in minutes. Scores compare areas within Vancouver. They are not a verdict on any place, and every number names its source and date.
How each score works
Price
Neighbourhood median rent for your bedroom count (CMHC, Oct 2025), ranked against the rest of Vancouver's blocks: the cheapest rents score near 100, the dearest near 0. For a listing: 100 at or below 90% of the area median, 0 at 140% or more.
Amenities
Groceries, restaurants, cafes and cinemas weighted by distance (35 / 30 / 20 / 15), ranked against the rest of Vancouver's blocks: 100 is the best-served, 50 the middle.
Safety
Police-reported property crime per resident, not raw counts. Each report is weighted by how serious it is (break-ins and vehicle theft count most; minor theft and mischief, half of all reports, count little). The weighted reports in a block and the 6 blocks around it are divided by the people who live there: per 1,000 residents, 2021 Census, with fewer than 100 residents counted as 100. That rate makes up 70% of the score and the neighbourhood's violent-crime rate per resident 30%. The result is a rank against the rest of Vancouver, not an absolute risk.
Only reports count from May–Sep 2026, the last 5 complete months. That keeps the scores about recent conditions, not a historic total. The window ends at the newest complete month in the police file, so a half-finished month is left out.
Residents come from the 2021 Census, so buildings first lived in after May 2021 are not counted yet.
Commute
The timed weekday route from each block to your campus on the TransLink schedule: walking, waiting and riding, with up to one transfer. Blocks with no stop within 800 m use the walking time. A map click and a listing check use the same route, and every figure in a report quotes that one time. 100 at 15 minutes or less, 0 at 60 or more.
Public transit access listing scorecard
Measured at the address. Every walk-up line counts once, at its stop nearest the address: weekday departures per hour there, weighted by how fast that kind of service runs on the schedule (SkyTrain 2, RapidBus and B-Line 1.2, bus 1) and by walking distance. 100 matches Vancouver's best-served areas (95th percentile). Night buses are listed, not scored.
Sources
- CrimeVancouver Police Department GeoDASH, May–Sep 2026
- PopulationStatistics Canada, 2021 Census, population by dissemination block
- BuildingsCity of Vancouver, property tax report 2026 (year built, major improvement)
- RentCMHC Rental Market Survey, October 2025
- TransitTransLink GTFS, weekday 20261014
- AmenitiesOpenStreetMap contributors, snapshot 2026-10-07
- BylawCity of Vancouver, Rental Standards current issues
- PermitsCity of Vancouver, issued building permits since 2024-10-01
- AddressesCity of Vancouver, property addresses
- ScootersCity of Vancouver, shared e-scooter stations (Lime), updated 2026-09-14
Limits
- City of Vancouver only for now.
- Crime counts are police reports, not a measure of risk to a person or a building.
- VPD asks that its data not be used to judge a specific property.
- CMHC zones and campus locations were matched by hand.
Route and arrival data used in this product or service is provided by permission of TransLink. TransLink assumes no responsibility for the accuracy or currency of the Data used in this product or service.
Map data © OpenStreetMap contributors (ODbL). Map tiles © Stadia Maps, © OpenMapTiles. City of Vancouver Open Data. Vancouver Police Department GeoDASH. CMHC Rental Market Survey.